Monday, April 30, 2012

#1940Census Status Update for 28 April 2012

FamilySearch Indexing 1940 Census Progress as of 28 April 2012On Saturday horses changed positions in the race to post 1940 census indexes.

FamilySearch.org jumped from last place into a tie with lead horse, Archives.com, both having now published Colorado and Delaware. As I last reported, the two members of the 1940 U.S. Census Community Project ought to always be tied, since they are sharing the same index. While it was surprising that FamilySearch didn’t post Colorado first, one can imagine FamilySearch holding off publication to allow more-or-less simultaneous publication with its partners.

MyHeritage.com and Ancestry.com remain unchanged.

Saturday I also witnessed something new on the FamilySearch indexing progress map. Two states, Indiana and Virginia, dropped from 100% to 99%. I understand this can occur when problems are discovered during the audits performed after indexing is finished for a state. For example, auditing may discover that many indexers are incorrectly indexing column 2, house number, rather than column 3, number of household. Double keying detects some of these problems, but if both indexers make the same mistake, then arbitrators aren’t alerted and can’t fix the mistake. When auditing detects problems, the batches have to be sent back for indexing.

States at 100% (not published): Alaska, Kansas, Nevada, New Hampshire, Oregon, Utah, Wyoming.

States at 99%: Arizona, Florida, Idaho, Indiana, Virginia.

Louisiana had the largest percentage increase from Friday to Saturday at 10%. You Louisiana indexers keep that up and you’ll be done in eight days!

Indexing big states is going to take some time. New York is ten times as big as the recently completed Colorado. However, indexers are making great inroads. Good job if you’re indexing the great (and big) state of Texas; you are 16% done. But you California indexers. Wow! Fourth largest state, 27% complete, 2% of that on Friday! If you could keep doing 2% a day, you’d be done in five more weeks.

You are Still Needed

The rate of indexing will slow if we don’t get more help. Why? When I am familiar with the regional place and people naming patterns, I can index much faster. Pseudo-French Utah names and Book of Mormon names could be a problem for someone else, but I grew up with Lapriel and Lavell and Moroni and Alma (a man) and the others. I know what towns are in Cache County. For me, indexing was a breeze.

You are needed for your state and for the states of your ancestors. Sign up at indexing.familysearch.org.

Saturday, April 28, 2012

1940 First Indexer Award

1940 Census First Indexer AwardThe displayer of this badge certifies that he or she is a proud indexer of the 1940 Census.

1. Name: Ancestry Insider

2. First Indexed: April 2012

3. First Batch: I think it was Philomath, Oregon

4. Favorite experience: My first batch was in block letters! Boy, that gave me the wrong expectation.

5. I learned about this award from the blog of: The Ancestry Insider (http://ancestryinsider.blogspot.com/2012/04/1940-first-indexer-award.html)

If you want to help index, visit http://indexing.familysearch.org.


Award Rules

To earn this award you must index or arbitrate at least one batch of the 1940 Census. Once you have submitted a batch:

1. Copy this entire post, including the rules.
2. Replace the answers to the questions.
3. If you wish, replace the badge with a different size or background. Pick from the choices at http://ancestryinsider.blogspot.com/2012/04/1940-census-award-badges.html
3. Post on your blog.
4. Display the award with pride alongside other awards and badges on your site.

1940 Census Award Badges

If you are helping index the 1940 U.S. Census, give yourself a pat an the back in the form of the “1940 Census First Indexer Award.”

Choose one of the following options and proudly display it on Facebook, Twitter, your blog or website.

For display on white or light backgrounds (100 pixels wide):

1940 Census First Indexer Award

For display on white or light backgrounds (200 pixels wide):

Blue Ribbon, 1940 on white, 200

For display on black or dark backgrounds (100 pixels wide):

Blue Ribbon, 1940 on black, 100

For display on black or dark backgrounds (200 pixels wide):

Blue Ribbon, 1940 on black, 200

See also, “1940 First Indexer Award.”

#1940Census Who Has the Best Images?

In my “1940 Census Image Viewer Comparison” article I noted how different websites took more or less time to display images. Ancestry.com took more than 3 seconds, Archives.gov took about 4, MyHeritage.com took about 17 seconds, and FamilySearch about 34.

The most significant factor affecting download time is the size of the image file. The most significant factor affecting file size is image quality. Thus, there is a tradeoff between download speed and image quality. The faster the download, the worse the quality. The better the quality, the slower the download.

Back on 9 April 2012 in the Monday Mailbox I made a stupid statement. “The Rowdy” asserted that Ancestry.com had the highest quality images. I replied that “NARA did the image scanning so Ancestry.com’s images can’t be better than everybody else’s.” I knew at the time that websites might modify the images prior to publication. But it seemed silly to say something like “Ancestry.com’s images can’t be better than everybody else’s unless everyone else messes up their images worse than Ancestry.” (Thank you to the several of you who kindly wrote pointing out different image qualities of different websites.)

Last time I talked about the quality of the images provided by the National Archives and Record Administration (NARA). As you look at the images provided on the different websites, keep in mind that the focus problems are largely NARA’s fault.

Ancestry.com

Ancestry.com applies an algorithm to its images to increase contrast. Whites become whiter and blacks become blacker. Most people like the resulting effect, as it matches our expectation as to what a black and white record should look like. On the plus side, it makes legible text more legible. On the minus side, it makes illegible text more illegible. The increased contrast also makes it easy to compress the images. Ancestry’s images are half the size of the NARA originals. That in turn allows Ancestry to display images twice as quickly.

image

While not as noticeable, Ancestry also straightened the images; the originals seeming to slope a little down to the right.

Archives.gov

Archives.gov used more compression to decrease the file size by three. You can see the effect if you zoom in close to the image. As shown below, compression causes squares to form in the background and fuzz to grow on the writing. The effect may not be noticeable at normal magnification, so long as the compression isn’t too aggressive.

image

FamilySearch.org

FamilySearch.org did nothing to compress its images. Consequently, FamilySearch has the slowest display time. As Ancestry, they rotated the images slightly to straighten them. FamilySearch also sharpened the images. To some degree, sharpening repairs some of the focus problems. However, sharpening exaggerates errors as much as the real stuff in the image. The original NARA images have weird vertical lines covering the entire image. Sharpening makes these easier to see in the FamilySearch images, even at normal magnification.

image

MyHeritage.com

MyHeritage reduced the size of the images, decreasing the number of pixels by four and increasing the fuzzy appearance of the images.

image

Conclusion

In a side by side comparison, below, it is clear that FamilySearch.org has the sharpest images. As one might expect, the website with the slowest image display has the crispest images.

image

Comparison Table

  Straightened Contrast Resized Compression File Size (MB) Display Speed
Original       1.0 4.712  
Ancestry.com Yes Increased   2.19 2.151 >3
Archives.gov       3.05 (largest) 1.545 4
FamilySearch.org Yes Sharpened   1.07 4.414 34
MyHeritage.com     Smaller 2.60 1.814 17

Thursday, April 26, 2012

Ancestry.com Intends to Acquire Archives.com

Archives.com + Ancestry.comAncestry.com announced Wednesday that they have signed an agreement to purchase Archives.com for $100 million plus assuming some of their debt.

“Since Archives.com’s launch in January 2010, the site has rapidly grown to more than 380,000 paying subscribers who pay approximately $39.95 a year,” said the Ancestry announcement.  “Archives.com offers access to over 2.1 billion historical records, including birth records, obituaries, immigration and passenger lists, historical newspapers, and U.S. and U.K. Censuses.”  Archives.com is owned and operated by Inflection, LLC.

“I want to emphasis that our plan is to keep Archives.com as a distinct brand and site, to continue to nurture its existing partnerships, and to continue to invest in new content, product and technology,” said Tim Sullivan, CEO of Ancestry.com.

Following the announcement, Sullivan convened a conference call with genealogy news writers to answer questions about the acquisition. Sullivan was joined by Joe Godfrey, general manager of Archives.com.

“Like we did with fold3, we’re only going to increase the investment,” Sullivan told us. “We’re going to do what we can to support their vision.”

“We’re not terribly worried about cannibalization.” Sullivan said there is an opportunity to have product and feature differentiation. Sullivan avoided saying how much content will be shared between the websites. Instead he stated that even with similar content, users will interact with that content in different ways. Godfrey explained that the user experience will differ on each site, such as complexity of search options and data presentation.

Sullivan said that one of the big values of the acquisition is the staff coming with the assets. “We wouldn’t do this deal if we weren’t incredibly excited about the Archive.com people that will be part of it.” Ancestry hopes to acquire a team of about 40 talented engineers, digital marketers, and family history innovators, including some offshore.

According to DearMYRTLE, volunteer indexers for the 1940 U.S. Census Community Project were already expressing concerns about the acquisition, wondering if they wanted to continue indexing if the index would be subsumed by Ancestry.

“I would encourage them to continue digitizing this important collection,” said Godfrey. Sullivan applauded efforts by the project’s volunteers and reassured indexers. Their work would be published free on Archives.com and Ancestry will continue to pursue its own index through their paid indexers. He said that having two or three indexes is good for the category.

Sullivan admired Archives.com’s partnership with the National Archives and Record Administration (NARA). Archives.com hosts NARA’s 1940 census website. While Sullivan denied the acquisition was influenced by brightsolid’s entry into the U.S. market, the acquisition places Ancestry squarely into the same business model brightsolid uses in the United Kingdom: offering the same content through multiple websites, partnershipping with the National Archive, and hosting websites for the archive.

I asked about monopoly concerns. The acquisition of one website by another in the same category always raises the question as to whether the acquisition will harm consumers by decreasing competition. Sullivan declined to say much concerning the company’s efforts to acquire governmental approval. “We’re pretty confident we can get through [the antitrust review],” said Sullivan. “We’re doing this to increase investment, increase choice. There is no negative to consumers.”

I asked about genealogy.com, another website that Ancestry acquired and subsequently allowed to decay into disrepair. “We made a decision that we didn’t have the bandwidth to do Ancestry.com and still support genealogy.com, our second brand.” Sullivan acknowledged the parallel in the acquisition of an additional brand, and admitted that they haven’t decided what they can do with genealogy.com. He said that part of the problem is that genealogy.com is built on old technology . “We are thinking, what can we do? What should it be?”

I asked who approached whom. Sullivan would not say. He and Matthew Monahan, Inflection president, had talked before Inflection created Archives.com and the two had kept in touch ever since. Several months ago the two had decided that the deal made sense.

According to Godfrey, “Ultimately, we and Ancestry have a shared view on what we want to create and fulfilling that vision is something we’re excited about.”

#1940Census Status Update for 25 April 2012

FamilySearch Indexing 1940 Census Progress as of 25 April 2012It’s been a while since my last update, but during that time, no website has published any indexes. With the Archives.com release of indexes for two states, they take the lead. They have published 1.16% of the 1940 census index.

Archives.com passed MyHeritage.com, at 0.82%, who held the lead since they finished the publication of Rhode Island.

Even though Ancestry.com has published two states, their completion percentage is just 0.30%. For more information about Ancestry.com’s publication plans, see “1940: Why There’s Nevada and Delaware But No Other Indexes … Yet.”

Given that FamilySearch is producing the indexes, it is interesting that Archives.com has published Colorado but FamilySearch.org has not. One can only assume that it is imminent, along with New Hampshire, Oregon, and Utah; all 100% indexed. Until then, FamilySearch.org brings up the rear with 0.21%.

FamilySearch Indexing has finished 19.9% of the census (not counting the territories, for which I have no data). Wow! If we can keep up this pace…

State

Images

FamilySearch Indexing Status

FamilySearch Index Publication

Ancestry.com Index Publication

Archives.com Publication

MyHeritage Index Publication

Alabama

79,715

15%


Alaska

3,988

98%


American Samoa

594


Arizona

15,327

95%


Arkansas

56,169

9%


California

198,780

22%


Colorado

36,206

100%


25-Apr


Connecticut

47,693

7%


Delaware

7,908

100%

11-Apr

5-Apr

25-Apr


District of Columbia

19,419

11%


Florida

57,708

93%


Georgia

89,264

5%


Guam

1,031


Hawaii

9,859

42%


Idaho

17,544

99%


Illinois

222,776

8%


Indiana

98,028

99%


Iowa

76,192

10%


Kansas

53,591

99%


Kentucky

77,708

6%


Louisiana

64,260

8%


Maine

26,106

15%


Maryland

52,575

6%


Massachusetts

121,354

5%


Michigan

149,720

6%


Minnesota

83,988

15%


Mississippi

59,470

49%


Missouri

108,108

14%


Montana

20,537

68%


Nebraska

39,048

15%


Nevada

3,526

99%


5-Apr


New Hampshire

14,927

100%


New Jersey

116,752

2%


New Mexico

16,605

12%


New York

370,269

3%


North Carolina

98,684

2%


North Dakota

22,654

13%


Ohio

195,018

6%


Oklahoma

67,557

16%


Oregon

34,745

100%


Panama Canal Zone

1,136


Pennsylvania

280,176

7%


Puerto Rico

39,524


Rhode Island

31,178

13%


by 11-Apr

South Carolina

53,091

3%


South Dakota

22,655

22%


Tennessee

83,336

4%


Texas

178,754

13%


Utah

16,666

100%


Vermont

10,512

92%


Virgin Islands

686


Virginia

61,395

99%


Washington

53,972

22%


West Virginia

52,199

8%


Wisconsin

89,733

5%


Wyoming

8,304

98%


51


Total Images

3,818,720

761,241

7,908

11,434

44,114

31,178


19.9%

0.21%

0.30%

1.16%

0.82%

Data as of


10:30am MDT,
25 April

10:30am MDT,
25 April

10:30am MDT,
25 April

7:30pm MDT,
25 April

10:30am MDT,
25 April

Wednesday, April 25, 2012

#1940Census Image Quality

Several of you have written in comparing image quality among the vendors. Before I compare the vendors, I want to first take a look at what they started with from the National Archives and Record Administration (NARA).

In short, I consider the NARA images to be substandard in almost every way.

A spokesperson from Archives.com confirmed that when you download a high-resolution image from the NARA website, you are getting an original image as delivered to all the vendors. All of the following snippets are taken from such a high-resolution copy of the page from last week's viewer comparison.

Microfilm Imperfections

It is evident from imperfections in the images that NARA scanned them from microfilm. I don’t know if the originals exist—probably not—but it would be too expensive to scan them in any case. As is evident in the image below, some of the imperfections are large enough to obscure parts of written information. The hair-like imperfection on the right is troubling for another reason that I will explain in a moment.

Imperfections in the 1940 census microfilm

Did NARA digitize the best copy of the microfilm that they have? From what I can remember about other years, the quality of this microfilm is the worst. (I’m ignoring the long vertical lines scratched into films by microfilm readers.)

Legibility

Consider the column headers shows the out. The headers below left were scanned by FamilySearch from the 1930 census. Compare to the headers on the right scanned by NARA from the 1940 census.

image

Double Exposures

The image below shows a double exposure. Notice how the signature line is doubled. This might have occurred when the form was printed, leaving the form blurry before the enumerator received it. However, Lapriel Hyers’s signature is also doubled. The form must have been fine.

The enumerator's signature is double exposed

The double exposure may have occurred when NARA digitized the microfilm. Maybe the scanner did not hold the film motionless while this part was digitized. NARA may have used substandard microfilm scanners or the scanners may not have been properly maintained or operated.

Focus

As I’ve indexed batches from all across the country, I’ve found all are out of focus to one degree or another. And the focus varies as you go down the page. Consider the header of column 15 shown below. The top is focused pretty well, but the farther you go down, the worse the focus gets.

The focus in the header of column 15 gets progressively worse

Conclusion

With any luck the focus and double exposures occurred when the film was digitized. That would be correctable by digitizing again. However, remember the hair-like microfilm imperfection I spoke about? It is in focus and has not been double exposed. That might indicate that the problems occurred when the records were microfilmed.

If that is the case, we are stuck with the low quality images forever.

Tuesday, April 24, 2012

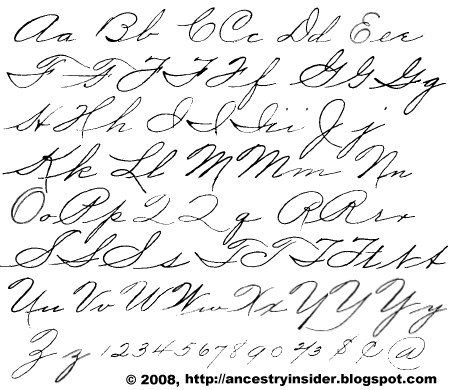
Indexing Tips: Cursive Writing

Some four years ago I wrote a series of articles about cursive handwriting for indexers. With many new indexers trying out FamilySearch Indexing, I thought it might be nice to offer the cursive tables again.

Print these out or bookmark this article for quick reference while indexing.

Palmer Method

The Palmer Method Cursive

For more information, see “Indexing Tips: The Palmer Method.”

Hughes and Taylor

Hughes and Taylor Cursive

For more information, see “Indexing Tips: The Palmer Method in New York City Schools.”

Zaner-Bloser

Zaner-Bloser Cursive

This illustration of traditional Zaner-Bloser is courtery Educational Fontware, Inc. For more information, see “Indexing Tips: 1900's American Handwriting.”

Monday, April 23, 2012

Monday Mailbox: Mobile Image viewing

Dear Readers,

In my comparison of census image viewers, I invited readers to try viewing the images via a mobile device and then report back. “Slogger” did just that. Read on…

Dear Ancestry Insider,

Thank you for this. I had given up on trying to browse the census images on my iPad 3G. On the subject of load times, not using a stopwatch, but just counting, the load times were all much longer than your results, with Family Search the longest. But the load times don't mean much if when you have the image you can't do anything with it.

Ancestry's viewer is unusable on the iPad unless all you want is to save the image.

Archive and Family Search let you pinch to zoom and drag to move the zoomed image but the resolution is very poor when zoomed. They do let you tap and hold to save the image.

The one I hadn't tried was MyHeritage which is the only one of the four that seems designed for the iPad platform. An uncluttered, plain interface, pinch to zoom and drag to move the image, but high-res, even zoomed. Previous and next arrows and and a drop-down page number list for direct access to any page in the ED. In order to save the page you have to press a download icon which opens the image in a new, static page which you tap-and-hold to save.

I was rooting for one of the other sites, but this is a no-brainer. MyHeritage is the only one usable on the iPad.

Signed,
Slogger

Dear Slogger,

Thank you very much. I intend to get a mobile device real soon now. I just can’t find the time or money. Your review is much appreciated.

Signed,
--The Insider

Thursday, April 19, 2012

#1940Census Image Viewer Comparison

FamilySearch image viewerI’m going to do some comparisons about the 1940 Census experience on the different websites. First up, the image viewers and load time. I’ll do image quality in a future article.

I used the Chrome browser and performed the test on Sunday afternoon in the 4pm MST hour. I used a stopwatch app on my rather old smart phone. I loaded images from Utah ED 3-15.

Ancestry.com

Ancestry.com had the fastest image load time, a bit over 3 seconds. Remember, your mileage may vary. The significance here is the comparison among the websites.

As I’ve reported before, Ancestry.com has switched to the Flash browser plugin (which I dislike). They no longer offer scroll bars, so getting from one corner to another can be painful. Zooming is smooth and easy using the mouse wheel or an onscreen control. Images can be downloaded or linked to people in your Ancestry Member Trees.

Ancestry chanced to the Flash viewer to provide some advanced features from indexed records. I’ll review those in the future. They’ve kept the old HTML viewer around, probably for mobile users. To switch back to the old HTML viewer select Actions > Options > Switch to Non-Interactive Viewer.

My smart phone isn’t smart enough to test image viewing on a tablet or phone. If you want to test it for me, try this URL: http://interactive.ancestry.com/2442/M-T0627-04210-00092?backurl=http%3a%2f%2fsearch.ancestry.com%2fsearch%2fdb.aspx%3fdbid%3d2442%26path%3d&ssrc=#imageId=M-T0627-04210-00177

Archives.gov

The image viewer for Archives.gov (Archives.com) is fast, taking about four seconds to load each image. The browser Back button doesn’t work. There is no zoom. The viewer is the only one of the four reviewed here that has scroll bars. Scroll bars allow you to quickly move to a desired area of the image. There is no way to directly jump to an image other than the previous or next images.

Images can be downloaded in standard or fine resolution. You can download a single image or an entire enumeration district. Before downloading, you have to do one of those obnoxious Captcha security checks. I suppose that is to prevent parties from “stealing” all these public domain images from the government.

To test the viewer on a mobile platform, use this URL: http://1940census.archives.gov/search/?search.census_year=1940&search.city=&search.county=Cache%20County&search.page=2&search.result_type=image&search.state=UT&search.street=#filename=m-t0627-04210-00177.tif&name=3-15&type=image&state=UT&index=24&pages=46&bm_all_text=Bookmark&searchby=location&searchmode=browse&year=1940

FamilySearch

Image viewing is slowest on FamilySearch, taking about 34 seconds an image. FamilySearch has no scroll bars, so when zoomed in, moving from one end of the image to the other takes a little work. Speaking of zooming in, FamilySearch seems to artificially constrain how far you can zoom, stopping short of the full 100% supported by other viewers.

You can jump to any image in an enumeration district by entering the image number and you can use the browser back button to return back through viewed images.

To test the FamilySearch viewer on a mobile device, click this link: https://familysearch.org/pal:/MM9.3.1/TH-1942-27861-7627-25?cc=2000219&wc=MM2Q-5RP:n20560615

MyHeritage

Image viewing on MyHeritage.com took about 17 seconds for an image. However, if I go on to other images and then come back, the image is displayed almost immediately. Don’t try to use the browser’s back button to go back, however. It doesn’t work. Use the drop-down list of image numbers to quickly click to any desired image.

MyHeritage’s image viewer does not have scroll bars. That can be inconvenient because, unlike the artificial limitation of zooming on FamilySearch.org, MyHeritage allows zooming to 100% and beyond.

Test this URL on a mobile device: http://www.myheritage.com/research/collection-10052/1940-united-states-federal-census-images?action=showRecord&itemId=15470088

Screen Capture

Screen captures with programs like Snag-It are popular among genealogists. Screen capture from these image viewers is problematic. I tested the image viewers with Chrome’s screen capture and found most capture options did not work and any of the websites.

  Capture page region Capture visible content Capture whole page Capture screen region
Ancestry.com No No No Yes
Archives.gov No Yes No Yes
FamilySearch.org No No No Yes
MyHeritage.com No No No Yes

Next time I will compare image quality of these vendors’ 1940 Census images.

Tuesday, April 17, 2012

1940 Census Status Update for 16 April 2012

FamilySearch Indexing 1940 Census Progress as of 16 April 2012Since my update last Thursday, FamilySearch finished posting all the census images.

FamilySearch Indexing numbers indicate that they have increased the amount indexed from 5% to 11%. Compare the table below with the table in my last update to see the progress.

Progress on posting indexes is not as rosy. The posting of Delaware by FamilySearch is the only progress reported by anyone. That brings FamilySearch to one-fifth of a percent (0.21%) of publishing indexes for all the 1940 census.

Ancestry.com has not updated their indexed states list for the last 10 days. They remain at 0.30% done.

MyHeritage has also gone without updating their list, stalling at 0.82%. That is enough to keep them in first place.

It appears to me that MyHeritage.com and Ancestry.com posted indexes for one or two token states, but are now proceeding with the task of indexing all states. That may not be true of FamilySearch.

Over the weekend FamilySearch informed indexers that they could publish more indexes sooner were it not for the one week indexers are given to index a batch.

States that are nearly ready to publish can still be held up by a few remaining, checked-out batches. For this reason, as a state nears completion, we will be reducing the amount of time that a batch can be checked out. Rather than the standard seven days, batches for nearly complete states will be made available on a decreasing scale from five days to three days to just one day as we get closer to the end.

FamilySearch also announced that indexers have broken records almost every day. They indexed 20 million records and arbitrated 10 million in the first week and a half of the project.

With several states hovering at 99% (Colorado, Kansas, and Oregon), perhaps we’ll see FamilySearch take the lead in the indexing horserace.

Stay tuned…

State

Images

FamilySearch Indexing Status

FamilySearch Index Publication

Ancestry.com Index Publication

MyHeritage Index Publication

Alabama

79,715

8%


Alaska

3,988

24%


American Samoa

594


Arizona

15,327

34%


Arkansas

56,169

2%


California

198,780

11%


Colorado

36,206

99%


Connecticut

47,693

1%


Delaware

7,908

100%

11-Apr

5-Apr


District of Columbia

19,419

2%


Florida

57,708

11%


Georgia

89,264

1%


Guam

1,031


Hawaii

9,859

6%


Idaho

17,544

65%


Illinois

222,776

4%


Indiana

98,028

61%


Iowa

76,192

1%


Kansas

53,591

99%


Kentucky

77,708

0%


Louisiana

64,260

5%


Maine

26,106

2%


Maryland

52,575

2%


Massachusetts

121,354

2%


Michigan

149,720

1%


Minnesota

83,988

9%


Mississippi

59,470

4%


Missouri

108,108

0%


Montana

20,537

17%


Nebraska

39,048

5%


Nevada

3,526

45%


5-Apr


New Hampshire

14,927

81%


New Jersey

116,752

0%


New Mexico

16,605

2%


New York

370,269

1%


North Carolina

98,684

0%


North Dakota

22,654

2%


Ohio

195,018

2%


Oklahoma

67,557

9%


Oregon

34,745

99%


Panama Canal Zone

1,136


Pennsylvania

280,176

4%


Puerto Rico

39,524


Rhode Island

31,178

4%


by 11-Apr

South Carolina

53,091

0%


South Dakota

22,655

8%


Tennessee

83,336

0%


Texas

178,754

7%


Utah

16,666

80%


Vermont

10,512

7%


Virgin Islands

686


Virginia

61,395

87%


Washington

53,972

4%


West Virginia

52,199

1%


Wisconsin

89,733

1%


Wyoming

8,304

37%


45


Total

3,818,720

409,461

7,908

11,434

31,178


11%

0.21%

0.30%

0.82%

Data as of


11:30am MDT,
16 Apr.

11:30am MDT,
16 Apr.

11:30am MDT,
16 Apr.

11:30am MDT,
16 Apr.

Friday, April 13, 2012

Darned Armie Cannon

Records say the darnedest things

We depend upon records to reveal the “truth” about our pasts.

Yet sometimes records have anomalies. Some are amusing or humorous. Some are interesting or weird. Some are peculiar or suspicious. Some are infuriating, even downright laughable.

Yes, Records say the Darnedest Things.”

Records Say the Darnedest Things: Darned Armie Cannon

Several years ago I read about Judy K. Wilson’s discovery that her Springfield family included a man in Alabama named Army Cannon Springfield.1 A search of FamilySearch shows that Armie Cannon Springfield died in 1962 at the age of 84 in Birmingham, Jefferson County, Alabama. A little math shows he was qualified to participate in the 3rd draft registration during World War I. Did Armie Cannon register for military service?

Finding Armie Cannon’s registration card would be simple on Ancestry.com. It has an index to the World War I draft registration cards. Finding the card on FamilySearch.org makes a good exercise of finding a record in a collection without an index.

1. Start at FamilySearch.org.

2. Down next to the world map click on All Record Collections.

3. In the search box, type some words from the title. (I typed “World War.”)

4. Click on the title (“United States, World War One Draft Registration Cards, 1917-1918” in this case).

5. Click on “Browse through (some number) of images” (“Browse through 25,007,403 images” in this case).

6. Click on the first choice. In this record collection, the choice is the state, but that varies by record collection. Depending on the record collection, there may be a second choice. In this record collection, the choice is the local draft board. Since Armie Cannon died in Birmingham, Jefferson County, Alabama, I guessed one of the Birmingham City draft boards, “Birmingham City no 3; LaBoutie, John B.-Z.”

7. The result after all the browse choices is a set of images. Each image in the set is numbered. The images are usually organized alphabetically, chronologically, or in some other fashion. The cards in this set are alphabetical by surname and then given name.

For this illustration, the set of images are numbered 1 to 5,486 images for surnames LaBoutie to Z. Z indicates the end of the list, regardless of the actual surname.

8. Take a guess at the image number. Until you get a little experience, picking half way through is as good as any. There is an official name for guessing halfway between the bounds. It is called “binary search.” The guesses don’t have to be exact. For 5,486 images, half is about 2,500. Enter 2500 without a comma.

9. Image 2500 is Albert Marin Reid. Keep track of your guesses, keeping in mind whether your desired image is above or below each guess. Armie Cannon Springfield is between Reid (image 2500) and Z (image 5486).

1 – LaBoutie
2500 – Reid


5486 - Z

10. Guess about halfway between the bounds you’ve established. I subsequently guessed 4500 (Walker), 3500 (Smith), and 4000. (I don’t do math very well in my head.) After several more guesses I had the range narrowed to five.

1 – LaBoutie
2500 – Reid
3500 – Smith
3600 – Spencer

3610 – Spooner

3615 – Stanfield
3625 – Stanley
3650 – Steakley
3700 – Stevens
4000 – Thomas

4500 – Walker
5486 - Z

I looked through the five and didn’t find Springfield!

I had guessed the wrong draft board!

It happens. Get over it. There are eight more draft boards in Jefferson county. Using binary search, it doesn’t take long to check an entire draft board.

P.S. I eventually found Armie Cannon Springfield. Can you imagine his conversation with the draft board?

“State your given names.”

“Armie Cannon.”

“Right. Gimme a break…”

Not surprisingly, he was born on the 1st of April.

image

“Mom? Dad? Why did you name me Armie Cannon?”

“April Fools, son!”

Yes, records say the darnedest things.


Sources

     1. Judy K. Wilson, “Humor/Humour,” RootsWeb Review, 3 October 2007, e-newsletter (http://ftp.rootsweb.ancestry.com/pub/review/2007/1003.txt : accessed 31 March 2012), section 6.)

Thursday, April 12, 2012

#1940Census Status Update for 11 April 2012

The indexing horserace has began even while horses continue to run the image race. Since my last update six days ago, FamilySearch’s image horse made progress, moving from 26% to 82% in less than a week.

Now on to the indexing horserace. My apples and oranges report here is certain to cause indigestion, but I’m rather constrained on what I can report.

FamilySearch map of indexing project completionFamilySearch has indexed 5% of the census. MyHeritage has published an index for 1% of the census, while Ancestry.com is at only one-third of one percent.

I should say “the 1940 U.S. Census Community Project” rather than FamilySearch, as volunteer indexers have been recruited by and are producing the indexes for Archives.com, FamilySearch, FindMyPast.com, FamilySearch, the National Archives, and (new member) ProQuest.

Now the caveats.

  • Ancestry.com has not updated their indexing status since last Friday. Still, I think it is current since they indicated that D.C. would be indexed next and I found it is not yet there.
  • FamilySearch publishes how far along each state indexing project is; Ancestry.com and MyHeritage do not so that information can’t be compared
  • FamilySearch has 5% indexed, but has yet to publish it. Both of the other parties have published something. How quickly FamilySearch can turn around a finished project is yet to be seen.

Apples versus oranges.

The comparison between Ancestry and MyHeritage is interesting in that it is an apples to apples comparison. Since my last update MyHeritage finished the state of Rhode Island, which has 31 thousand pages. Ancestry has finished two states, but together they have but 11 thousand pages. That puts MyHeritage three times as far along as Ancestry.

Apples versus apples.

As with the images horserace, I’m just measuring how far along each horse is. There’ll be time enough for comparing index quality after the dust settles. May the best horse win.

State

Images

FamilySearch Images

FamilySearch Indexing Status

Ancestry.com Index Publication

MyHeritage Index Publication

Alabama

79,715

3-Apr

5%


Alaska

3,988


American Samoa

594

by 11-Apr


Arizona

15,327


2%


Arkansas

56,169

by 11-Apr

0%


California

198,780

6-Apr

6%


Colorado

36,206

2-Apr

93%


Connecticut

47,693


Delaware

7,908

2-Apr

100%

5-Apr


District of Columbia

19,419

by 11-Apr


Florida

57,708

2-Apr

7%


Georgia

89,264

by 11-Apr

0%


Guam

1,031

by 11-Apr


Hawaii

9,859


Idaho

17,544

by 11-Apr


Illinois

222,776

by 11-Apr

2%


Indiana

98,028

by 11-Apr

6%


Iowa

76,192


Kansas

53,591

2-Apr

89%


Kentucky

77,708


Louisiana

64,260

4-Apr

3%


Maine

26,106


Maryland

52,575

by 11-Apr

0%


Massachusetts

121,354


0%


Michigan

149,720

by 11-Apr


Minnesota

83,988

6-Apr

5%


Mississippi

59,470

4-Apr

3%


Missouri

108,108

by 11-Apr

0%


Montana

20,537


1%


Nebraska

39,048

by 11-Apr

1%


Nevada

3,526

by 11-Apr


5-Apr


New Hampshire

14,927

5-Apr

25%


New Jersey

116,752


New Mexico

16,605


New York

370,269

by 11-Apr


North Carolina

98,684

by 11-Apr


North Dakota

22,654


Ohio

195,018

by 11-Apr

0%


Oklahoma

67,557

3-Apr

5%


Oregon

34,745

2-Apr

89%


Panama Canal Zone

1,136

by 11-Apr


Pennsylvania

280,176

5-Apr

2%


Puerto Rico

39,524

by 11-Apr


Rhode Island

31,178

by 11-Apr


by 11-Apr

South Carolina

53,091


South Dakota

22,655


0%


Tennessee

83,336

by 11-Apr


Texas

178,754

5-Apr

3%


Utah

16,666

by 11-Apr

0%


Vermont

10,512

by 11-Apr


Virgin Islands

686

by 11-Apr


Virginia

61,395

2-Apr

39%


Washington

53,972

by 11-Apr


West Virginia

52,199


Wisconsin

89,733

by 11-Apr


Wyoming

8,304


28 states


Total

3,818,720

3,127,696

201,321

11,434

31,178


82%

5%

0%

1%

Data as of


9:00am MDT,
11 Apr.

9:00am MDT,
11 Apr.

4:09am MDT,
6 Apr.

9:00am MDT,
11 Apr.

*In the table, “by 11-Apr” means the state was finished sometime since my last update. Since I didn’t check everyday, I don’t know the exact day.